| Country Code | Number of ATMs | Unique Cities | Unique States |
|---|---|---|---|
| CU (Cuba) | 4 | 1 | 2 |
| DE (Germany) | 89 | 32 | 2 |
| GB (United Kingdom) | 36 | 10 | 4 |
| IT (Italy) | 25 | 8 | 1 |
| JP (Japan) | 83 | 19 | 2 |
| KR (South Korea) | 6 | 5 | 1 |
| MH (Marshall Islands) | 8 | 3 | 1 |
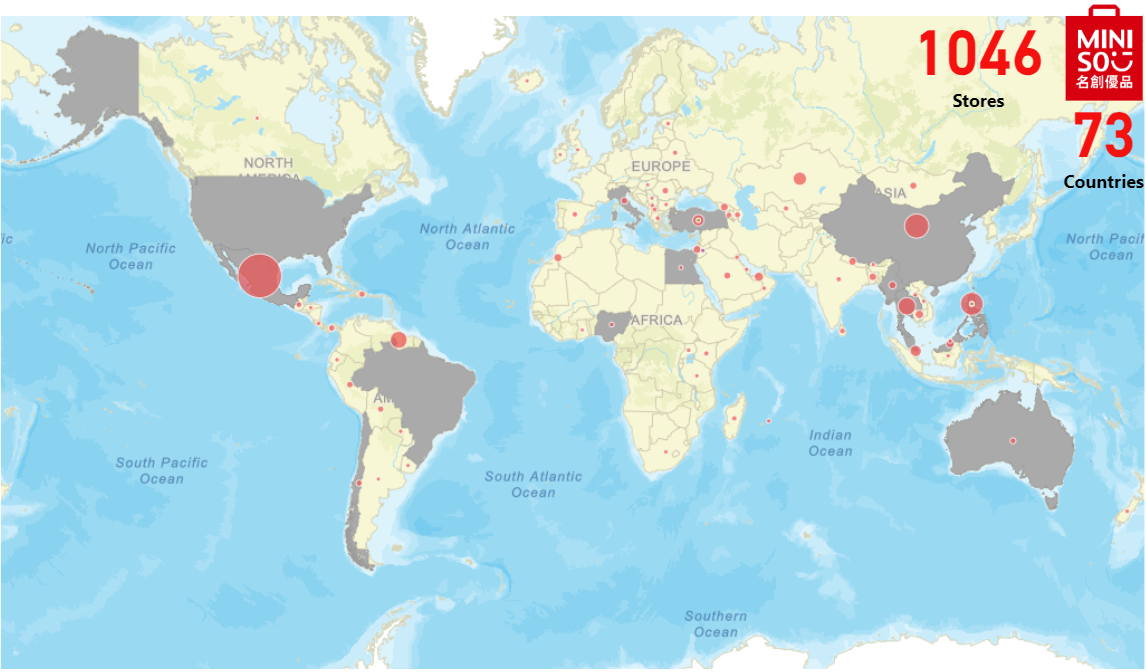
| US (United States) | 30507 | 5833 | 51 |
General Overview
- The dataset primarily contains information about ATM locations in the United States, with a total of 30,507 ATMs spread across 5,833 cities and 51 states.
- Other countries represented in the dataset have significantly fewer ATM locations listed.
Country-Specific Insights
- United States (US): With over 30,000 ATMs, the U.S. has a vast network of ATM locations. This distribution reflects a high accessibility to ATMs across different cities and states, catering to both urban and rural areas.
- Germany (DE) and Japan (JP): These countries have a noticeable presence in the dataset with 89 and 83 ATMs, respectively. The ATM locations are spread across various cities, indicating good accessibility within these countries.
- United Kingdom (GB): With 36 ATMs across 10 cities, the UK has a moderate presence in the dataset. The distribution across four states suggests a spread across different regions of the country.
- Italy (IT): Despite having 25 ATMs listed, they are all located within a single state, which may indicate a concentration of ATM locations in a specific region.
- South Korea (KR), Cuba (CU), and Marshall Islands (MH): These countries have fewer ATMs listed, with a range of 4 to 8 ATMs each. The ATM locations are concentrated in a small number of cities and states.
Potential Applications and Considerations
- Accessibility: The data can be used to analyze the accessibility of ATMs in different regions, helping to identify areas that may be underserved.
- Expansion Planning: Financial institutions could use this data to plan the expansion of their ATM networks, especially in countries or regions with fewer ATMs listed.
- User Convenience: Ensuring a widespread and convenient access to ATMs is crucial, and this data can help in assessing how well different regions are served.
Limitations and Considerations
- Data Completeness: The dataset may not be exhaustive, and there could be additional ATMs not listed.
- Potential Biases: The dataset might be biased towards certain regions or financial institutions, affecting the analysis.
- Update Status: It’s unclear how up-to-date the dataset is. Changes in ATM locations over time could affect the accuracy of the insights.
Conclusion
This dataset provides a valuable snapshot of ATM locations across various countries, predominantly the United States. Analyzing this data helps in understanding the distribution of ATMs and can aid in making informed decisions to improve accessibility and convenience for users.
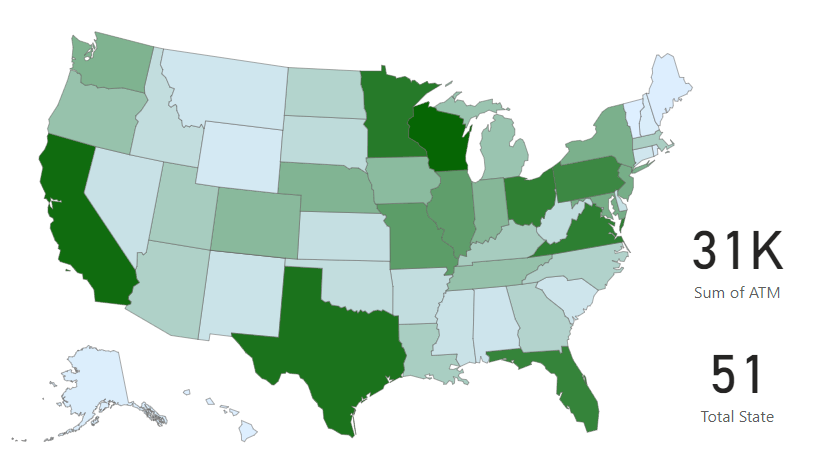
USA State Wise Density Data
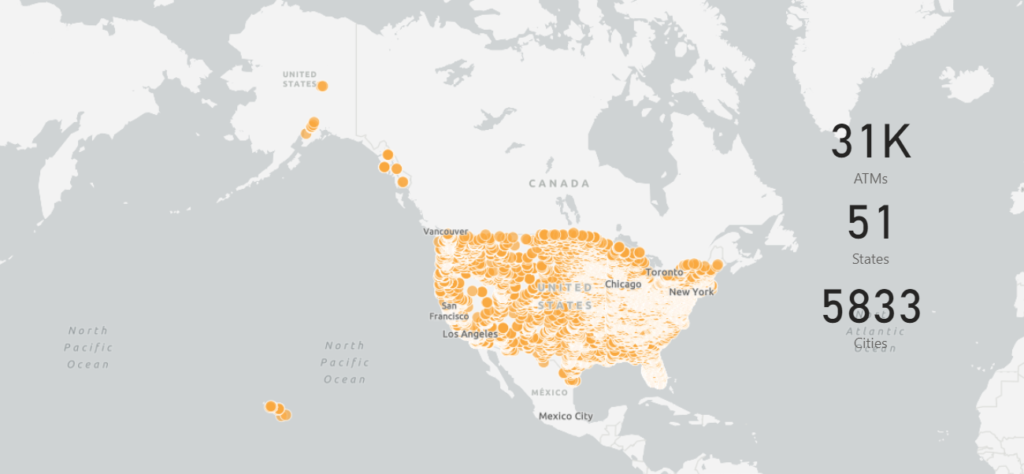
Top 20 US Cities Data
| Rank | State | City | ATM Count | City Population (Est.) | ATMs per Million Persons |
| 1 | KY | LOUISVILLE | 126 | 617,638 | 204.00 |
| 2 | NE | LINCOLN | 118 | 290,605 | 406.05 |
| 3 | TX | HOUSTON | 116 | 2,304,580 | 50.33 |
| 4 | NE | OMAHA | 112 | 486,051 | 230.43 |
| 5 | TX | SAN ANTONIO | 104 | 1,434,625 | 72.49 |
| 6 | VA | VIRGINIA BEACH | 104 | 450,189 | 231.01 |
| 7 | NY | NEW YORK | 101 | 8,336,817 | 12.11 |
| 8 | TX | AUSTIN | 100 | 961,855 | 103.97 |
| 9 | CO | DENVER | 100 | 715,522 | 139.76 |
| 10 | TX | FORT WORTH | 95 | 909,585 | 104.44 |
| 11 | DC | WASHINGTON | 90 | 689,545 | 130.52 |
| 12 | OK | OKLAHOMA CITY | 87 | 655,057 | 132.81 |
| 13 | OR | PORTLAND | 87 | 652,503 | 133.33 |
| 14 | VA | RICHMOND | 86 | 226,610 | 379.51 |
| 15 | AZ | PHOENIX | 84 | 1,608,139 | 52.23 |
| 16 | PA | PHILADELPHIA | 82 | 1,576,251 | 52.02 |
| 17 | MD | BALTIMORE | 81 | 585,708 | 138.29 |
| 18 | CA | LOS ANGELES | 77 | 3,898,747 | 19.75 |
| 19 | TN | KNOXVILLE | 77 | 190,740 | 403.69 |
| 20 | OH | COLUMBUS | 76 | 905,748 | 83.91 |
1. City with the Highest ATM Availability:
- Knoxville, TN has the highest number of ATMs per million persons with approximately 403.69 ATMs.
- This high availability could be due to a strong banking presence, tourist activities, or a business-friendly environment.
2. City with the Lowest ATM Availability:
- New York, NY has the lowest number of ATMs per million persons with approximately 12.11 ATMs.
- Despite having a high number of ATMs in absolute terms, the extremely high population of New York dilutes the availability per million persons.
3. Cities with High ATM Counts but Varied Availability:
- Louisville, KY and Lincoln, NE both have high ATM counts (126 and 118 respectively), but their ATM availability per million persons is quite different (204.00 for Louisville and 406.05 for Lincoln).
- This difference is mainly due to the population size, showcasing how population density impacts ATM availability.
4. Comparing Large vs Small Cities:
- Larger cities like Houston, TX, and Los Angeles, CA have lower ATM availability per million persons compared to smaller cities like Knoxville, TN, and Richmond, VA.
- This suggests that in larger cities, the ATM network might be spread thinner across a larger population.
5. Geographical Trends:
- Cities from a variety of states are represented in the top 20, indicating a widespread availability of ATMs across different regions.
6. Potential Areas for Improvement:
- Cities with lower ATM availability per million persons might benefit from an increased number of ATMs, especially in densely populated areas or regions with high economic activity.
7. Correlation with Economic Activity:
- Further analysis could be done to correlate ATM availability with economic activity, as cities with higher business or tourist activity might have a higher demand for ATMs.
8. Impact of Digital Banking:
- The trend towards digital banking and cashless transactions might also impact the demand and availability of ATMs in the future.
ATM presence in 20 highly populated cities, along with their estimated populations:
| City | Population (Est.) | State(s) | ATM Count | |
| 0 | NEW YORK | 8,336,817 | NY | 101 |
| 1 | LOS ANGELES | 3,898,747 | CA | 77 |
| 2 | CHICAGO | 2,679,080 | IL | 32 |
| 3 | HOUSTON | 2,304,580 | MO, TX | 119 |
| 4 | PHOENIX | 1,608,139 | AZ, MD | 85 |
| 5 | PHILADELPHIA | 1,576,251 | NJ, PA | 84 |
| 6 | SAN ANTONIO | 1,434,625 | TX | 104 |
| 7 | SAN DIEGO | 1,398,260 | CA | 55 |
| 8 | DALLAS | 1,343,573 | TX, PA, OR, NC | 44 |
| 9 | SAN JOSE | 1,013,240 | CA | 64 |
| 10 | AUSTIN | 961,855 | MN, TX | 103 |
| 11 | JACKSONVILLE | 929,647 | AL, FL, IL, TX | 46 |
| 12 | FORT WORTH | 909,585 | TX | 95 |
| 13 | COLUMBUS | 905,748 | NE, WI, OH, GA, MT, IN, KS | 118 |
| 14 | INDIANAPOLIS | 876,384 | IN | 18 |
| 15 | CHARLOTTE | 874,579 | MI, NC | 69 |
| 16 | SAN FRANCISCO | 870,887 | CA | 41 |
| 17 | SEATTLE | 769,714 | WA | 60 |
| 18 | DENVER | 715,522 | CO, NC | 102 |
| 19 | WASHINGTON | 689,545 | MO, PA, NJ, NC, CT, MI, IL, IA, DC, UT | 126 |
- Cities like Houston, Phoenix, Philadelphia, Columbus, and Washington have ATMs listed under multiple states, which could be due to the presence of cities with the same name in different states or due to the inclusion of ATMs in nearby areas.
- Houston, TX and Columbus, OH have particularly high ATM counts compared to other cities in the list.
- New York, NY, despite being the most populous city, does not have the highest ATM count in the dataset.
The ATM presence in 20 highly populated cities, along with their estimated populations, expected ATM counts based on the average of 27.21 ATMs per million persons, and the gap between the actual and expected ATM counts:
| City | Population (Est.) | ATM Count | Expected ATM Count | ATM Gap | |
| 0 | WASHINGTON | 689,545 | 117 | 18.76 | -98.24 |
| 1 | DENVER | 715,522 | 102 | 19.47 | -82.53 |
| 2 | COLUMBUS | 905,748 | 118 | 24.65 | -93.35 |
| 3 | AUSTIN | 961,855 | 103 | 26.17 | -76.83 |
| 4 | FORT WORTH | 909,585 | 95 | 24.75 | -70.25 |
| 5 | CHARLOTTE | 874,579 | 69 | 23.80 | -45.20 |
| 6 | SEATTLE | 769,714 | 60 | 20.94 | -39.06 |
| 7 | SAN ANTONIO | 1,434,625 | 104 | 39.04 | -64.96 |
| 8 | SAN JOSE | 1,013,240 | 64 | 27.57 | -36.43 |
| 9 | PHILADELPHIA | 1,576,251 | 84 | 42.89 | -41.11 |
| 10 | PHOENIX | 1,608,139 | 85 | 43.76 | -41.24 |
| 11 | HOUSTON | 2,304,580 | 119 | 62.71 | -56.29 |
| 12 | JACKSONVILLE | 929,647 | 46 | 25.30 | -20.70 |
| 13 | SAN FRANCISCO | 870,887 | 41 | 23.70 | -17.30 |
| 14 | SAN DIEGO | 1,398,260 | 55 | 38.05 | -16.95 |
| 15 | DALLAS | 1,343,573 | 44 | 36.56 | -7.44 |
| 16 | INDIANAPOLIS | 876,384 | 18 | 23.85 | 5.85 |
| 17 | LOS ANGELES | 3,898,747 | 77 | 106.08 | 29.08 |
| 18 | NEW YORK | 8,336,817 | 101 | 226.84 | 125.84 |
| 19 | CHICAGO | 2,679,080 | 32 | 72.90 | 40.90 |
- A negative “ATM Gap” value indicates that the city has fewer ATMs than expected based on the average ATM presence.
- A positive “ATM Gap” value indicates that the city has more ATMs than expected.
From the table, we can see that cities like New York, Los Angeles, and Chicago have a positive ATM gap, suggesting that they have more ATMs than expected based on the average ATM presence. On the other hand, cities like Washington, Denver, and Columbus have a negative ATM gap, indicating that they have fewer ATMs than expected.
Overview
- Cities with Excess ATMs: The majority of the cities in the list show a negative ATM gap, indicating that they have more ATMs than expected based on the average of 27.21 ATMs per million persons.
- Cities Needing More ATMs: A few cities, such as New York, Los Angeles, Chicago, and Indianapolis, show a positive ATM gap, suggesting a need for more ATMs.
Specific Insights
Excess ATMs
- Washington: With a gap of -98.24, this city has the highest excess of ATMs. This might be due to being the capital city, potentially requiring more ATMs for tourists and governmental activities.
- Denver and Columbus: Both cities have a significant excess of ATMs, with gaps of -82.53 and -93.35, respectively. This might be due to a high concentration of financial institutions or a well-developed ATM network.
- Houston: Despite being one of the most populous cities in the list, it still has an excess of ATMs with a gap of -56.29.
Need for More ATMs
- New York: As the most populous city in the list, it shows the highest need for more ATMs with a gap of 125.84. This suggests that the current number of ATMs might not be sufficient for the massive population and the numerous tourists visiting the city.
- Los Angeles and Chicago: These major cities also show a need for more ATMs, with gaps of 29.08 and 40.90, respectively.
General Trends
- The majority of cities on this list have more ATMs than the average would suggest, indicating that the distribution of ATMs might not be proportional to the population in these areas.
- The larger cities, particularly New York, Los Angeles, and Chicago, seem to have a shortage of ATMs based on their population, suggesting a potential area of focus for financial institutions.
Conclusion and Recommendations
- Reevaluate ATM Placement: Financial institutions might want to reevaluate the placement of ATMs in these cities, potentially redistributing them to better meet the demands of the population.
- Focus on Larger Cities: Larger cities, especially New York, might require additional ATMs to adequately serve their populations.
- Consider Other Factors: Other factors such as tourist activity, business density, and local regulations might also play a significant role in determining the optimal number of ATMs.
Top 20 State data:

| State | ATM Count | Population | ATMs per Million Persons |
| Wisconsin | 1888 | 5893718 | 320.3410818 |
| California | 1805 | 39538223 | 45.65202639 |
| Texas | 1708 | 29145505 | 58.60251864 |
| Minnesota | 1611 | 5706494 | 282.3099437 |
| Virginia | 1546 | 8631393 | 179.1136147 |
| Ohio | 1533 | 11799448 | 129.9213319 |
| Florida | 1483 | 21538187 | 68.85444908 |
| Pennsylvania | 1420 | 13002700 | 109.2080876 |
| Missouri | 1139 | 6154913 | 185.0554183 |
| Illinois | 1117 | 12812508 | 87.18043337 |
| New Jersey | 903 | 9294493 | 97.15430417 |
| Maryland | 902 | 6185278 | 145.830147 |
| New York | 868 | 20154649 | 43.06698668 |
| Washington | 838 | 7693612 | 108.9215313 |
| Nebraska | 819 | 1934408 | 423.3853458 |
| Indiana | 777 | 6785528 | 114.5084067 |
| Colorado | 751 | 5773714 | 130.0722551 |
| Iowa | 728 | 3190369 | 228.1867709 |
| Tennessee | 647 | 6910840 | 93.62103594 |
| Oregon | 631 | 4237256 | 148.9171294 |
Summary Statistics
- ATM Count: The average number of ATMs across the states is around 1,183, with a standard deviation of 415, indicating variability in the distribution. The minimum and maximum ATM counts are 647 and 1,888, respectively.
- Population: The average population of the states is around 11.7 million, with a considerable variation as shown by the standard deviation of 9.6 million. The state with the smallest population has around 1.9 million residents, while the state with the largest population has around 39.5 million.
- ATMs per Million Persons: On average, there are around 150 ATMs per million persons across the states, with a standard deviation of 100.5. The density of ATMs per million persons ranges from 43 to 423.
Insights
- ATM Accessibility: There is a wide range in ATM accessibility across different states, as indicated by the “ATMs per Million Persons” metric. Nebraska, with 423 ATMs per million persons, has significantly higher ATM accessibility compared to other states.
- Population vs. ATM Count: Larger states in terms of population do not necessarily have a higher number of ATMs. For example, California has the largest population but does not have the highest number of ATMs. This could be due to a more spread out population or other factors affecting ATM placement.
- ATM Density: The ATM density does not have a straightforward correlation with the population or the raw ATM count. States with a mid-range population, like Wisconsin and Minnesota, have high ATM densities, indicating good accessibility of ATMs per capita.
- Potential Areas for Improvement: States with lower ATM densities, such as California and New York, could potentially benefit from an increase in ATM accessibility, especially in areas with higher populations.
Recommendations
- Improve Accessibility in Populous States: For states with large populations but lower ATM densities, stakeholders could explore opportunities to increase ATM accessibility.
- Examine Underlying Factors: Understanding the factors that contribute to higher ATM densities in certain states could provide insights for improvements in other regions.
Conclusion
The data reveals a varied landscape of ATM accessibility across different states, not strictly correlated with population size. Analyzing the underlying factors contributing to these disparities could provide valuable insights for improving banking accessibility.